Dashboards
Brief Connect includes a set of Azure Monitor Workbook dashboards that give you visibility into how your environment is being used and how it is performing. The dashboards are deployed directly to your Application Insights instance.
What's included
The download contains two workbook dashboards and a deployment script:
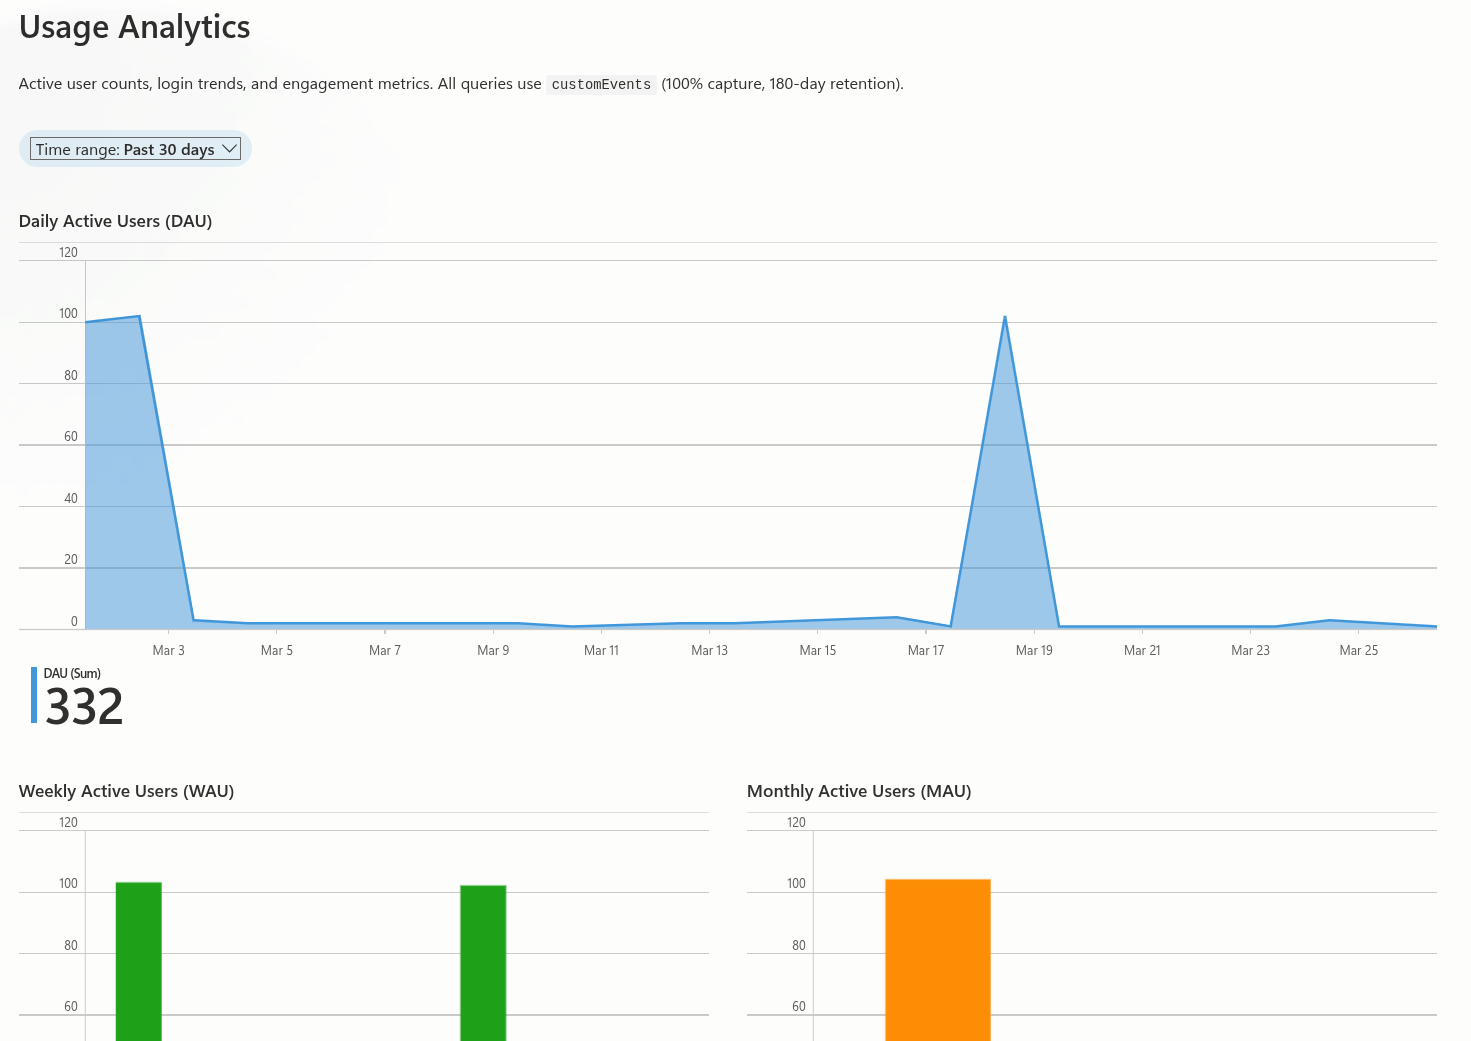
- Usage Analytics — Active user counts (DAU/WAU/MAU), login trends, user stickiness ratio, and record activity over time.
- Operational Health — Request throughput, error rates, dependency health, latency percentiles, and exception trends.
It also includes a library of standalone KQL queries you can run ad-hoc against your Application Insights instance for deeper investigation.
Download
Deploying the dashboards
Prerequisites
You need the Azure CLI (az) — this is pre-installed in Azure Cloud Shell.
- Extract the zip and open a terminal in the extracted folder.
-
Run the deployment script, passing your resource group:
./dashboards/Deploy-Workbooks.ps1 -ResourceGroup "your-resource-group" -
The script will:
- Discover the Application Insights resource in the resource group (prompts if more than one exists)
- Auto-detect the Azure region
- Deploy both workbooks using deterministic IDs, so re-running the script updates them in place
-
Open your Application Insights resource in the Azure portal and navigate to Workbooks to view the dashboards.
Included KQL queries
The download also includes standalone .kql query files organised by category. These can be run directly in the Application Insights Logs blade or via the Azure CLI.
Analytics
| Query | Description |
|---|---|
daily-active-users.kql |
Distinct users performing any action per day |
weekly-active-users.kql |
Distinct users per ISO week |
monthly-active-users.kql |
Distinct users per calendar month |
login-count-by-day.kql |
Total login events and unique users per day |
login-by-hour-and-day.kql |
Login count by hour-of-day and day-of-week |
user-stickiness-ratio.kql |
DAU / rolling 30-day MAU engagement ratio |
record-activity-by-day.kql |
Daily record created/updated/accessed counts |
Performance
| Query | Description |
|---|---|
request-volume-and-error-rate.kql |
Request count and error percentage over time |
request-latency-percentiles.kql |
P50/P95/P99 response duration by operation |
dependency-health-summary.kql |
Volume, error rate, and latency by dependency type |
Debugging
| Query | Description |
|---|---|
top-failing-operations.kql |
Operations ranked by failure count and rate |
exceptions-over-time.kql |
Exception count by type over time |
dependency-failures-over-time.kql |
Dependency failure trends by type |